The solidwastekampala package provides the household-level data behind the paper “Quantity and composition of domestic solid waste in Kampala City as influenced by socioeconomic factors” by Katukiza et al. (2026), published in Frontiers in Environmental Science (doi:10.3389/fenvs.2026.1889921). Over a seven-day measurement campaign, the study team weighed the domestic solid waste generated by 103 households in three Kampala parishes selected to represent different income levels: Bwaise I (low), Bukoto I (middle), and Ggaba (high). Each record combines the measured mass of ten waste categories with derived per-household metrics and the socio-economic characteristics of the household and its dwelling. The package contains one analysis-ready dataset together with a full variable dictionary.
Associated publication
If you use these data, please cite the paper they belong to:
Katukiza, A. Y., Niwagaba, C. B., Feni, I., Namagembe, S., Semiyaga, S., Batte, A., & Manga, M. (2026). Quantity and composition of domestic solid waste in Kampala City as influenced by socioeconomic factors. Frontiers in Environmental Science, 14. https://doi.org/10.3389/fenvs.2026.1889921
@article{10.3389/fenvs.2026.1889921,
  author  = {Katukiza, Alex Y. and Niwagaba, Charles B. and Feni, Ivan and
             Namagembe, Shaluwa and Semiyaga, Swaib and Batte, Abubakar and
             Manga, Musa},
  title   = {Quantity and composition of domestic solid waste in Kampala
             City as influenced by socioeconomic factors},
  journal = {Frontiers in Environmental Science},
  volume  = {14},
  year    = {2026},
  doi     = {10.3389/fenvs.2026.1889921},
  url     = {https://www.frontiersin.org/journals/environmental-science/articles/10.3389/fenvs.2026.1889921},
  issn    = {2296-665X}
}
Please also cite the data package itself (see Citation).
Installation
You can install the development version of solidwastekampala from GitHub with:
# install.packages("devtools")
devtools::install_github("openwashdata/solidwastekampala")
## Run the following code in console if you don't have the packages
## install.packages(c("dplyr", "knitr", "readr", "stringr", "gt", "kableExtra"))
library(dplyr)
library(knitr)
library(readr)
library(stringr)
library(gt)
library(kableExtra)
Alternatively, you can download the individual datasets as a CSV or XLSX file from the table below.
- Click Download CSV. A window opens that displays the CSV in your browser.
- Right-click anywhere inside the window and select “Save Page As…”.
- Save the file in a folder of your choice.
| dataset | CSV | XLSX |
|---|---|---|
| solidwastekampala | Download CSV | Download XLSX |
Data
The package provides access to one dataset with the waste measurements and socio-economic characteristics of the 103 analyzed households.
solidwastekampala
The dataset solidwastekampala contains the mass of ten waste categories collected from each household over a seven-day period, the derived per-household metrics (total, per-day, per-capita, volume, and density), and the socio-economic characteristics of the household and its dwelling. It has 103 observations and 37 variables.
solidwastekampala |>
  head(3) |>
  gt::gt() |>
gt::as_raw_html()| id | household_id | division | parish | zone | income_level | occupants | age_head | gender_head | education_head | profession_head | monthly_income_ugx | respondent | period_of_stay | occupancy | housing_quality | roof_material | wall_material | floor_material | water_access | sanitation_facility | road_condition | waste_food_kg | waste_garden_kg | waste_wood_kg | waste_textiles_kg | waste_paper_kg | waste_polythene_kg | waste_plastics_kg | waste_glass_kg | waste_metals_kg | waste_other_kg | waste_total_kg | waste_per_day_kg | waste_per_capita_kg | volume_l | density_kg_l |
|---|---|---|---|---|---|---|---|---|---|---|---|---|---|---|---|---|---|---|---|---|---|---|---|---|---|---|---|---|---|---|---|---|---|---|---|---|
For an overview of the variable names, see the following table.
| variable_name | variable_type | description |
|---|---|---|
| id | integer | Package-level unique household identifier (1-103), following the row numbering of the All_data sheet in the raw workbook (Bwaise I, then Bukoto I, then Ggaba). |
| household_id | character | Household label as recorded on the area sheet (for example Household_7); values repeat across parishes and contain gaps, so id is the unique key. |
| division | character | Kampala City division the household is located in (Kawempe, Makindye, or Nakawa). |
| parish | character | Study parish the household is located in (Bwaise I = low income, Bukoto I = middle income, Ggaba = high income area). |
| zone | character | Administrative zone within the parish where the household is located. |
| income_level | c(“ordered”, “factor”) | Income level of the household’s study area as classified in the study design; ordered factor with levels low < middle < high. |
| occupants | integer | Number of people living in the household during the 7-day waste collection period. |
| age_head | c(“ordered”, “factor”) | Age of the household head in years; ordered factor with levels 18-35 < 36-60 < >60. |
| gender_head | character | Gender of the household head (Female or Male). |
| education_head | c(“ordered”, “factor”) | Highest education level of the household head; ordered factor with levels Illiterate < Primary < Secondary < Tertiary. |
| profession_head | character | Profession of the household head (Business, Government employee, Housewife, Private employee, or Retired). |
| monthly_income_ugx | c(“ordered”, “factor”) | Monthly household income band in Uganda shillings (UGX); ordered factor with levels <500,000 < 500,000-1,000,000 < 1,000,000-3,000,000 < >3,000,000. |
| respondent | character | Household member who answered the questionnaire (Household head, Spouse, Son/daughter, or Niece/nephew). |
| period_of_stay | c(“ordered”, “factor”) | How long the household has lived at the premises; ordered factor with levels <1 year < 1-3 years < 3-5 years < >5 years. |
| occupancy | character | Occupancy status of the premises (Occupied by owner or Rented). |
| housing_quality | character | Type of dwelling as a proxy for housing quality (Bungalow, Story building, or Temporary). |
| roof_material | character | Main roof material of the dwelling (Cemented, Iron sheets, Iron sheets/tiles, or Tiles); Bwaise I recorded only the combined Iron sheets/tiles category. |
| wall_material | character | Main wall material of the dwelling (Bricks, Concrete blocks, or Mud/poles). |
| floor_material | character | Main floor material of the dwelling (Cemented, Mud, or Tiles). |
| water_access | character | Main drinking water access of the household (House connection, Stand pipe, or Yard tap). |
| sanitation_facility | character | Whether the household’s sanitation facility is shared with other households (Shared facilities or Not shared facilities). |
| road_condition | character | Condition of the access road to the household (Paved or Unpaved). |
| waste_food_kg | numeric | Mass of food waste generated by the household over the 7-day collection period, in kilograms (ASTM waste category). |
| waste_garden_kg | numeric | Mass of garden waste generated by the household over the 7-day collection period, in kilograms (ASTM waste category). |
| waste_wood_kg | numeric | Mass of wood waste generated by the household over the 7-day collection period, in kilograms (ASTM waste category). |
| waste_textiles_kg | numeric | Mass of textile waste generated by the household over the 7-day collection period, in kilograms (ASTM waste category). |
| waste_paper_kg | numeric | Mass of paper waste generated by the household over the 7-day collection period, in kilograms (ASTM waste category). |
| waste_polythene_kg | numeric | Mass of polythene waste generated by the household over the 7-day collection period, in kilograms (ASTM waste category). |
| waste_plastics_kg | numeric | Mass of plastic waste generated by the household over the 7-day collection period, in kilograms (ASTM waste category). |
| waste_glass_kg | numeric | Mass of glass waste generated by the household over the 7-day collection period, in kilograms (ASTM waste category). |
| waste_metals_kg | numeric | Mass of metal waste generated by the household over the 7-day collection period, in kilograms (ASTM waste category); for Ggaba Household_7 the value 2.674 was stored as text in the raw sheet and is excluded from that household’s recorded waste_total_kg. |
| waste_other_kg | numeric | Mass of waste not covered by the other nine categories, generated by the household over the 7-day collection period, in kilograms (ASTM waste category). |
| waste_total_kg | numeric | Total mass of waste generated by the household over the 7-day collection period, in kilograms, as recorded in the raw sheet (SUM of the ten category columns). |
| waste_per_day_kg | numeric | Mean daily mass of waste generated by the household, in kilograms per day (waste_total_kg divided by 7). |
| waste_per_capita_kg | numeric | Mean daily mass of waste generated per household member, in kilograms per person per day (waste_per_day_kg divided by occupants). |
| volume_l | numeric | Volume of the waste generated by the household over the 7-day collection period, in litres. |
| density_kg_l | numeric | Bulk density of the generated waste, in kilograms per litre; multiply by 1000 for kg/m3 as reported in the paper. |
Example
The example reproduces the headline figures of the paper: mean per-capita waste generation and mean waste density by income level.
library(solidwastekampala)
library(dplyr)
library(ggplot2)

solidwastekampala |>
  group_by(income_level) |>
  summarise(
    households = n(),
    waste_kg_capita_day = round(mean(waste_per_capita_kg), 2),
    density_kg_m3 = round(mean(density_kg_l) * 1000)
  )
#> # A tibble: 3 × 4
#>   income_level households waste_kg_capita_day density_kg_m3
#>   <ord>             <int>               <dbl>         <dbl>
#> 1 low                  39                0.43           368
#> 2 middle               32                0.53           571
#> 3 high                 32                0.98           325
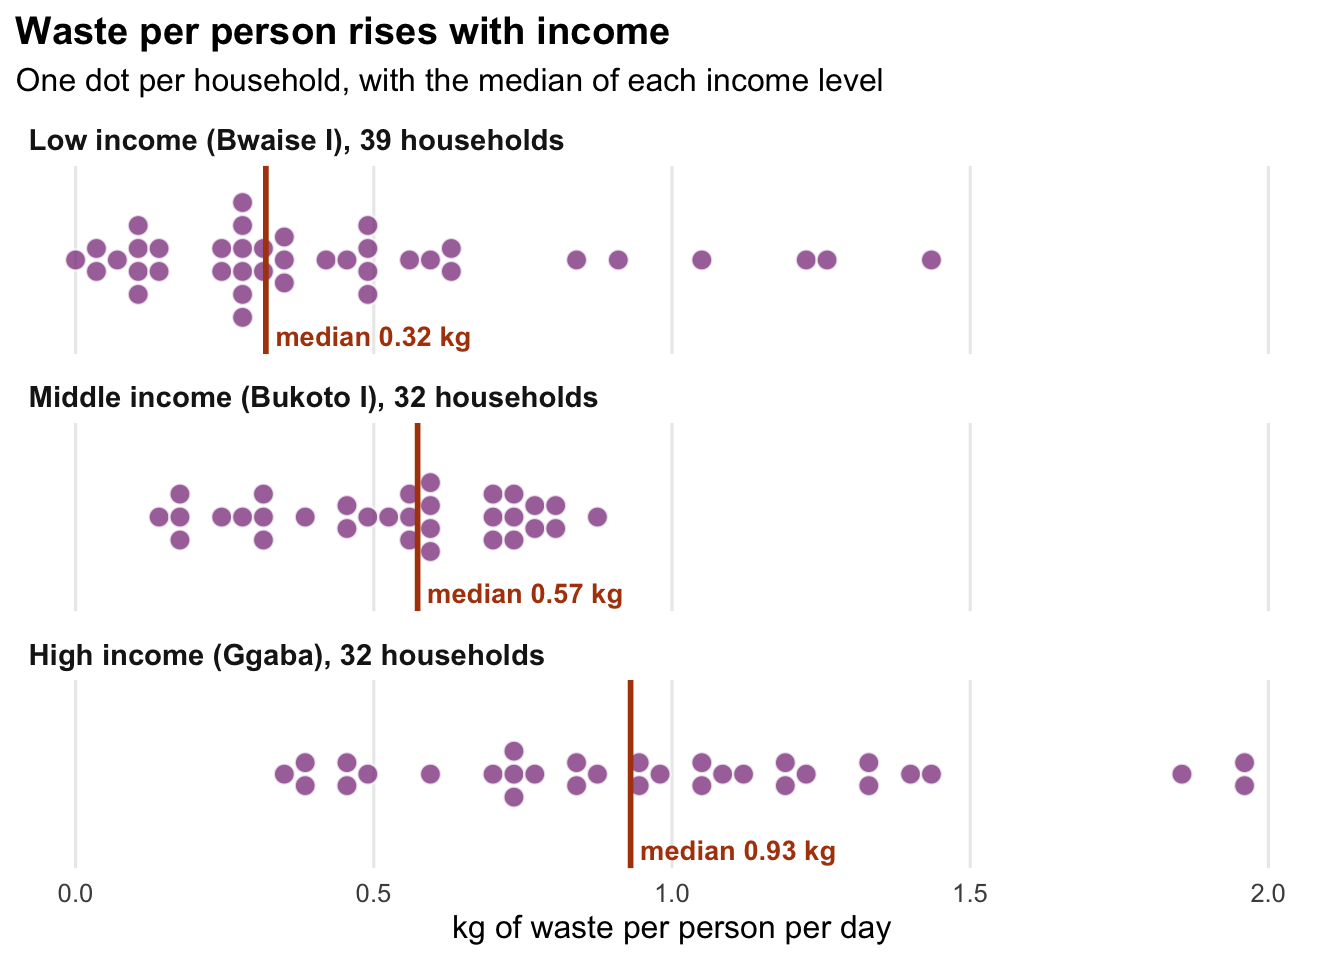
The figure at the top of this page shows the households behind those numbers, one dot per household. Waste per person rises with the income level of the study area: the median goes from 0.32 kg per person per day in Bwaise I (low) to 0.57 kg in Bukoto I (middle) and 0.93 kg in Ggaba (high), where the spread across households is also widest. The code below reproduces it. The article Waste per person by income shows an interactive version of this chart.
households <- solidwastekampala |>
  mutate(
    title = paste0(
      tools::toTitleCase(as.character(income_level)), " income (",
      parish, "), ", n(), " households"
    ),
    .by = income_level
  ) |>
  mutate(title = reorder(title, as.integer(income_level)))

medians <- households |>
  summarise(median = median(waste_per_capita_kg), .by = title)

ggplot(households, aes(x = waste_per_capita_kg)) +
  geom_dotplot(
    binwidth = 0.035, method = "histodot", stackdir = "center",
    stackratio = 1.1, fill = "#8a3a8a", colour = "white", alpha = 0.75
  ) +
  geom_vline(
    data = medians, aes(xintercept = median),
    colour = "#b04208", linewidth = 1
  ) +
  geom_text(
    data = medians,
    aes(
      x = median, y = -0.5,
      label = paste("median", round(median, 2), "kg")
    ),
    colour = "#b04208", fontface = "bold", hjust = -0.05, vjust = 0,
    size = 3.6
  ) +
  facet_wrap(~ title, ncol = 1) +
  scale_x_continuous(limits = c(0, 2), breaks = seq(0, 2, 0.5)) +
  scale_y_continuous(NULL, breaks = NULL) +
  labs(
    x = "kg of waste per person per day",
    title = "Waste per person rises with income",
    subtitle = "One dot per household, with the median of each income level"
  ) +
  theme_minimal(base_size = 12) +
  theme(
    strip.text = element_text(face = "bold", hjust = 0, size = 11),
    panel.grid.minor = element_blank(),
    plot.title = element_text(face = "bold"),
    plot.title.position = "plot"
  )
License
Data are available as CC-BY.
Citation
Please cite this package using:
citation("solidwastekampala")
#> To cite package 'solidwastekampala' in publications use:
#>
#>   Katukiza A, Niwagaba C, Feni I, Namagembe S, Semiyaga S, Batte A,
#>   Schöbitz L, Manga M (2026). "solidwastekampala: Quantity and
#>   Composition of Domestic Solid Waste in Kampala City."
#>   doi:10.5281/zenodo.21519796
#>   <https://doi.org/10.5281/zenodo.21519796>.
#>   <https://openwashdata.github.io/solidwastekampala/>.
#>
#> A BibTeX entry for LaTeX users is
#>
#>   @Misc{katukiza_etall:2026,
#>     title = {solidwastekampala: Quantity and Composition of Domestic Solid Waste in Kampala City},
#>     author = {Alex Y. Katukiza and Charles B. Niwagaba and Ivan Feni and Shaluwa Namagembe and Swaib Semiyaga and Abubakar Batte and Lars Schöbitz and Musa Manga},
#>     year = {2026},
#>     doi = {10.5281/zenodo.21519796},
#>     url = {https://openwashdata.github.io/solidwastekampala/},
#>     abstract = {Domestic solid waste generation and composition data for 103 households in Kampala City, Uganda, collected over a seven-day measurement campaign in three parishes representing different income levels (Bwaise I, low income; Bukoto I, middle income; Ggaba, high income). Includes ten measured waste-category masses, derived per-household metrics, and household socio-economic characteristics. The data accompany the paper "Quantity and composition of domestic solid waste in Kampala City as influenced by socioeconomic factors" (Katukiza et al. 2026, Frontiers in Environmental Science, <https://doi.org/10.3389/fenvs.2026.1889921>).},
#>     version = {1.0.2},
#>   }