The goal of fslogisticskampala is to provide data on faecal sludge transporting logistics in Kampala, Uganda. The package contains two datasets: trips records the GPS locations of emptying trucks collecting sludge from pit latrines and septic tanks, and trucks records the volume of each truck. The records cover the period from 30th March 2015 until 25th June 2015. The raw data was published as supplementary material of an open-access article in the journal Sustainability (MDPI).
Installation
You can install the development version of fslogisticskampala from GitHub with:
# install.packages("devtools")
devtools::install_github("openwashdata/fslogisticskampala")
## Run the following code in console if you don't have the packages
## install.packages(c("dplyr", "knitr", "readr", "stringr", "gt", "kableExtra", "leaflet"))
library(dplyr)
library(knitr)
library(readr)
library(stringr)
library(gt)
library(kableExtra)
library(leaflet)
Alternatively, you can download the individual datasets as a CSV or XLSX file from the table below.
| dataset | CSV | XLSX |
|---|---|---|
| trips | Download CSV | Download XLSX |
| trucks | Download CSV | Download XLSX |
Data
The package provides access to two datasets trips and trucks.
trips
The dataset trips contains data about the GPS locations of faecal sludge trucks collecting sludge from pit latrines and septic tanks in Kampala, Uganda. Each trip is recorded with a unique identifier, the numberplate of the truck, the date and time of the record. Data was collected from 30th March 2015 until 25th June 2015. It has 5653 observations and 7 variables
trips |>
  head(3) |>
  gt::gt() |>
gt::as_raw_html()| fid | numberplate | date | time | lat | lon | plant |
|---|---|---|---|---|---|---|
For an overview of the variable names, see the following table.
| variable_name | variable_type | description |
|---|---|---|
| fid | integer | Running ID for each recorded GPS location of a truck. |
| numberplate | character |
Numberplate of the truck, can be joined with trucks resource.
|
| date | Date | Date of the record in ISO 8601 format. |
| time | c(“hms”, “difftime”) | Time of the record in hours, minutes, seconds. |
| lat | numeric | Latitude of the record. |
| lon | numeric | Longitude of the record. |
| plant | character | Treatment plant that the truck delivered faecal sludge to. |
trucks
The dataset trucks contains data about additional information on the volume of each truck used in the dataset trips. It has 33 observations and 2 variables
trucks |>
  head(3) |>
  gt::gt() |>
gt::as_raw_html()| numberplate | volume |
|---|---|
For an overview of the variable names, see the following table.
| variable_name | variable_type | description |
|---|---|---|
| numberplate | character |
Numberplate of the truck, can be joined with trips resource.
|
| volume | numeric | Volume of the truck in cubic meters. |
Example 1
The figure below (chunk plot-collection-locations) shows the collection locations of the truck with number plate “UAS 119X” during the first week of data collection, coloured by collection date.
library(fslogisticskampala)
library(ggplot2)
library(lubridate)

uas <- trips |>
  dplyr::filter(numberplate == "UAS 119X") |>
  dplyr::filter(date < ymd("2015-04-06"))

ggplot(uas, aes(x = lon, y = lat, color = date)) +
  geom_point() +
  labs(title = "Collection locations of truck UAS 119X",
       subtitle = "30th March to 5th April 2015",
       x = "Longitude",
       y = "Latitude",
       color = "Date") +
  theme_minimal()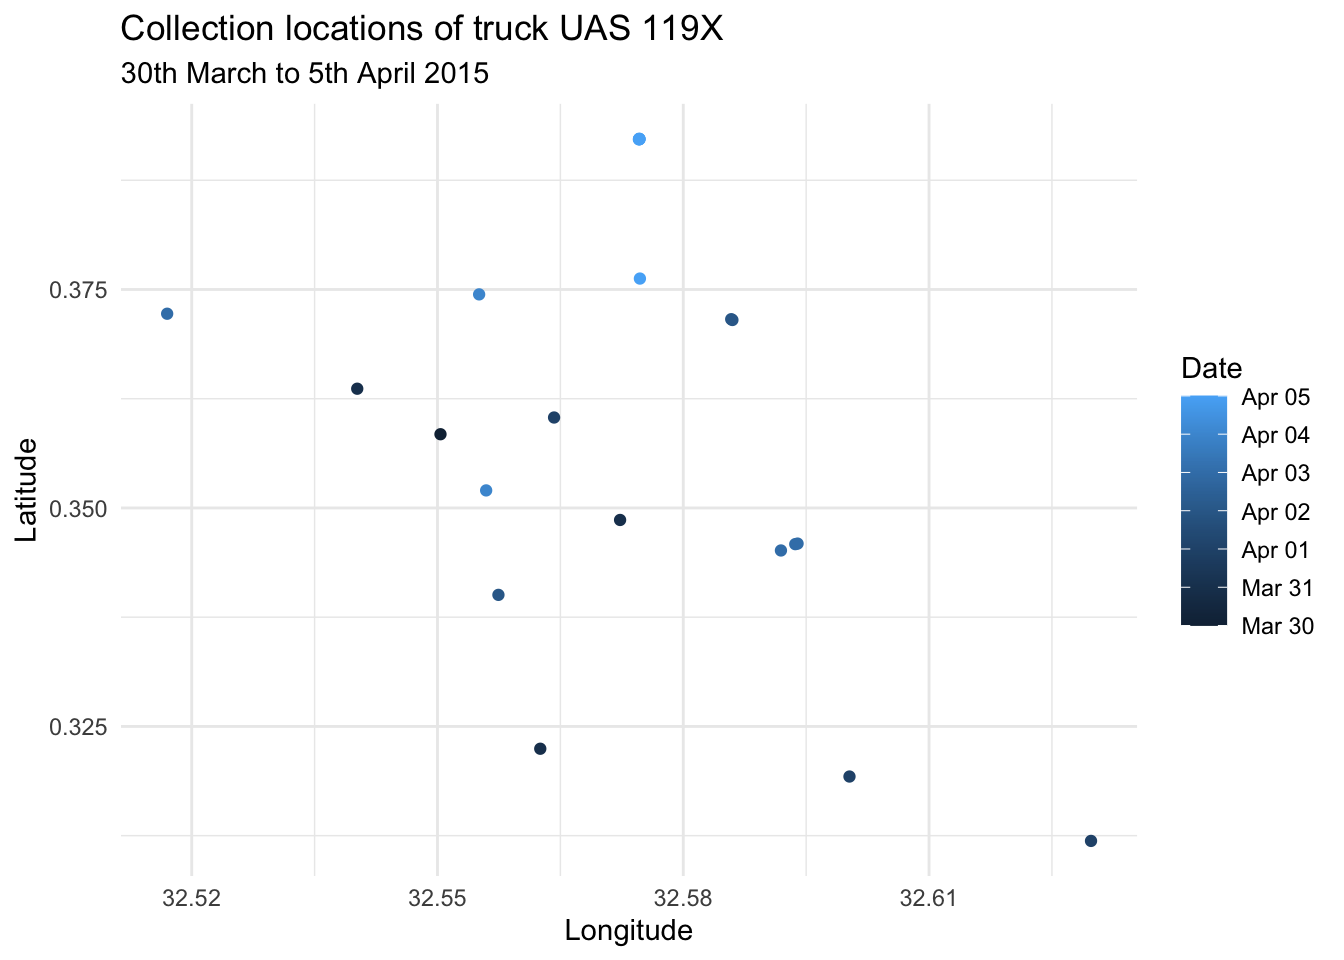
Example 2
The map below (chunks build-map and map-screenshot) shows all collection points, coloured red for Bugolobi and blue for Lubigi, together with markers for the two treatment plants. It is shown as a static image, because GitHub does not render interactive JavaScript widgets in Markdown. For the fully interactive version (pan, zoom, click), see the article Interactive map of collection locations on the package website.
map <- leaflet(data = trips) |>
  addTiles() |>
  addCircleMarkers(
    ~lon, ~lat,
    popup = ~as.character(plant),
    color = ~ifelse(plant == "Bugolobi", "red", "blue"),
    radius = 0.5
  ) |>
  addMarkers(
    lng = ~c(32.6071673, 32.5458844),
    lat = ~c(0.3190139, 0.3472747),
    popup = ~c("Bugolobi FS treatment plant", "Lubigi FS treatment plant")
  )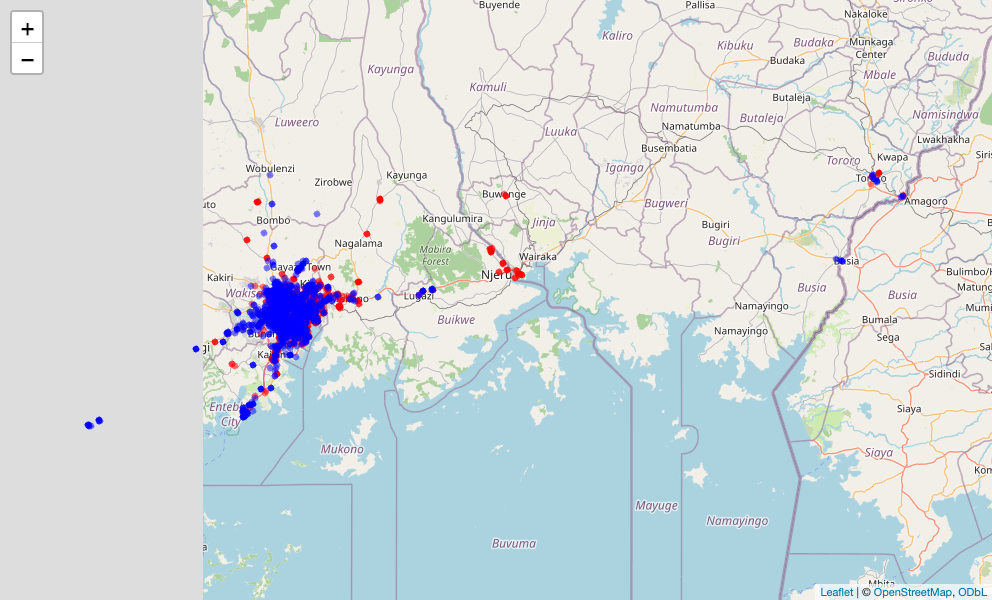
The interactive map was contributed by Jos van der Ent as part of a capstone project for the Data Science for Open WASH Data course.
License
Data are available as CC-BY.
Citation
Please cite this package using:
citation("fslogisticskampala")
#> To cite package 'fslogisticskampala' in publications use:
#>
#>   Schöbitz L (2026). "fslogisticskampala: Data on Faecal Sludge
#>   Transporting Logistics in Kampala, Uganda."
#>   doi:10.5281/zenodo.21260446
#>   <https://doi.org/10.5281/zenodo.21260446>.
#>   <https://github.com/openwashdata/fslogisticskampala>.
#>
#> A BibTeX entry for LaTeX users is
#>
#>   @Misc{schobitz:2026,
#>     title = {fslogisticskampala: Data on Faecal Sludge Transporting Logistics in Kampala, Uganda},
#>     author = {Lars Schöbitz},
#>     year = {2026},
#>     doi = {10.5281/zenodo.21260446},
#>     url = {https://github.com/openwashdata/fslogisticskampala},
#>     abstract = {Contains two data resources. `trips` contains the GPS locations of faecal sludge emptying trucks collecting sludge from pit latrines and septic tanks in Kampala, Uganda. Each trip is recorded with a unique identifier, the numberplate of the truck, the date and time of the record. Data was collected from 30th March 2015 until 25th June 2015. `trucks` has additional information on the volume of each truck.},
#>     version = {1.0.0},
#>   }